CARE
About
The Critical Analysis Reporting Environment (CARE) is a data analysis software package originally designed for problem identification and countermeasure development in traffic safety applications.
It uses advanced analytical and statistical techniques to generate valuable information directly form data.
Using CARE’s step-by-step on screen menus, it is easy to turn data into enlightening information.
CARE provides:
- descriptive statistics
- information mining
- geographical information system access
- roadway engineering support
- dashboard support
CARE’s dashboard support includes access to real-time statistics on key law enforcement systems including:
- traffic citations
- crash reports
- criminal incident reports
- other critical systems for which we have developed field data capture software
Dashboards have been deployed for:
- police agencies
- traffic engineers
- traffic safety stakeholders
While its primary use is for traffic safety, CARE can be used to process any database including:
- emergency medical services
- medical data
- nursing data
- questionnaires
- criminal justice
The CARE software for traffic safety applications is available free of charge. In order to take full advantage of CARE, existing data must be converted into a CARE dataset. In the case of a state, initial state CARE data sets can be created by having the state’s current database read by CARE’s Extract=Translate-Load (ETL) to produce the various CARE datasets that form the CARE warehouse. CAPS can create the initial state CARE dataset for your state for a reasonable fee. Contact Us.
The CARE software exists in both a desktop version for Windows OS and a Web version. CARE can be downloaded here or installed from a CD. Additionally, some highway safety CARE capabilities are also available online at the CARE Online Analysis site.
CARE is an award-winning program:
NHTSA 1995 Administrator’s Public Service Award
Runner-up for the 20015 ATSIP Best Practice Award.
Using the CARE program will undoubtedly assist the traffic safety program of any organization that chooses to use it.
CARE Overview Video
Features
-
- Statistical Generation: CARE retrieves summary information for the entire database or for any part (or subset) of it. Its Filters Menu allows the creation or combination of filters that restrict consideration to any specific subset of the database (e.g., alcohol, pedestrian, bicycle, motorcycle, particular counties or other geographical areas). Any attribute, or any combination of attributes, can be used to create filters, enabling the easy generation of literally any statistic.
-
- Data Analysis: Charts and graphical displays are produced for any or all variables in the database. A frequency output of any variable or a cross-tabulation of any two variables is instantly displayed. (Note that the words variables and attributes are used interchangeably – for crash records, these are essentially the data elements collected on the crash report form.)
-
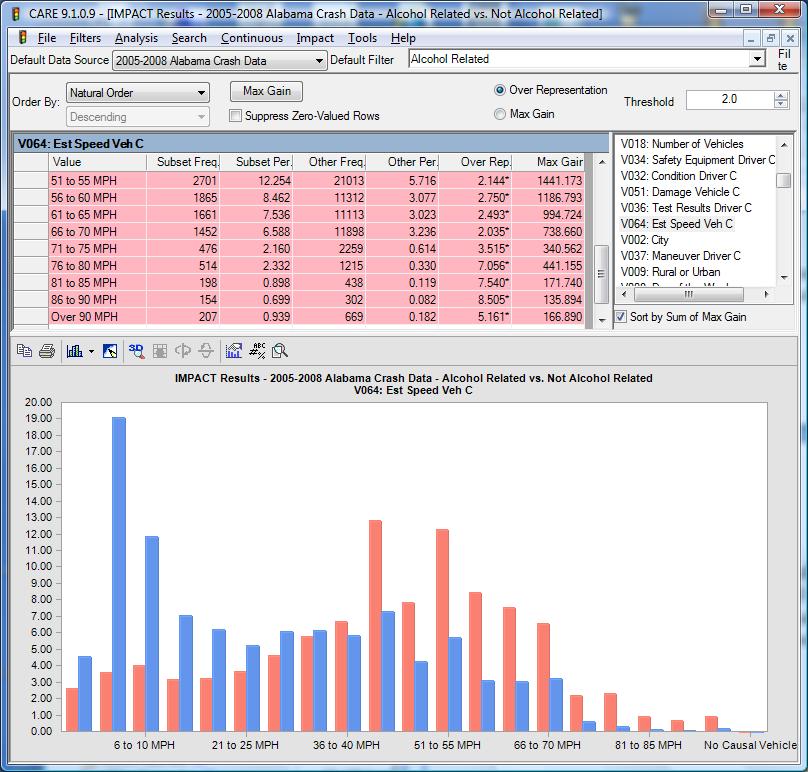
- Information Mining Capability: One of the most useful capabilities of CARE lies in its unique information mining capability, called IMPACT. IMPACT automatically generates information from the data without users having to specify queries or, for that matter, even know what the attributes are in their databases. All the user has to do is to specify one or two filters. IMPACT can compare two subsets of data using a single filter, e.g., alcohol crashes vs. non-alcohol crashes. An example of this is given below for the impact speed attribute. In this example, the red bars in the chart are for the alcohol crash subset. The blue bars in the chart are for non-alcohol crashes. It is quite clear that the alcohol crashes have significantly and dramatically higher impact speeds, which clearly accounts for their higher severities.
 Users do not have to specify the attributes to be processed by IMPACT. Any or all can be processed simultaneously, and the results can be ordered according to the most significant first. Statistical tests are performed for all IMPACT results. Clearly, IMPACT provides the the ability to obtain crucial information from the database without having to generate endless queries. Latent information is mined out of the database, analyzed, and instantly presented in both graphical and tabular charts. The results are prioritized indicating areas where countermeasures will provide maximum gain. The information discovery potential is unlimited, offering decision-makers unprecedented information-generation power from their data warehouses.
- Information Mining Capability: One of the most useful capabilities of CARE lies in its unique information mining capability, called IMPACT. IMPACT automatically generates information from the data without users having to specify queries or, for that matter, even know what the attributes are in their databases. All the user has to do is to specify one or two filters. IMPACT can compare two subsets of data using a single filter, e.g., alcohol crashes vs. non-alcohol crashes. An example of this is given below for the impact speed attribute. In this example, the red bars in the chart are for the alcohol crash subset. The blue bars in the chart are for non-alcohol crashes. It is quite clear that the alcohol crashes have significantly and dramatically higher impact speeds, which clearly accounts for their higher severities.
-
- Non-Categorical Variables: CARE is not limited to what are called “categorical” variables, i.e., those with discrete values, such as time of day, day of the week, contributing circumstances. Some applications require continuous variables, such as temperatures, distances or other such measurements. Non-categorical variables can be specified to the CARE ETL when creating a CARE dataset, allowing a list of values directly from the available raw data as opposed to being restricted to a known list of discrete values or ranges.
-
- Narrative Data Searching: CARE can process narrative descriptions, such as that within traffic crash narratives. The goal is to generate filters to identify those records where particular words of word combinations occur. This can be quite useful since sometimes the narrative contains information that is not in the categorical variables. For example, a categorical variable may contain the fact that a deer was struck. However, it is rare that any categorical variable will contain the fact that a driver was taking evasive action to avoid a deer. This information is contained strictly in the narrative. CARE enables a word or phrase to be used to create the filter from the narrative. This filter can be combined (ORed) with all other related filters to produce the subset desired. In order to assure that the words or phrases are being used appropriately, users can view the context and either approve or disapprove the particular record. At that point, the “Generate Filter” button creates a filter that includes all of the records selected.
-
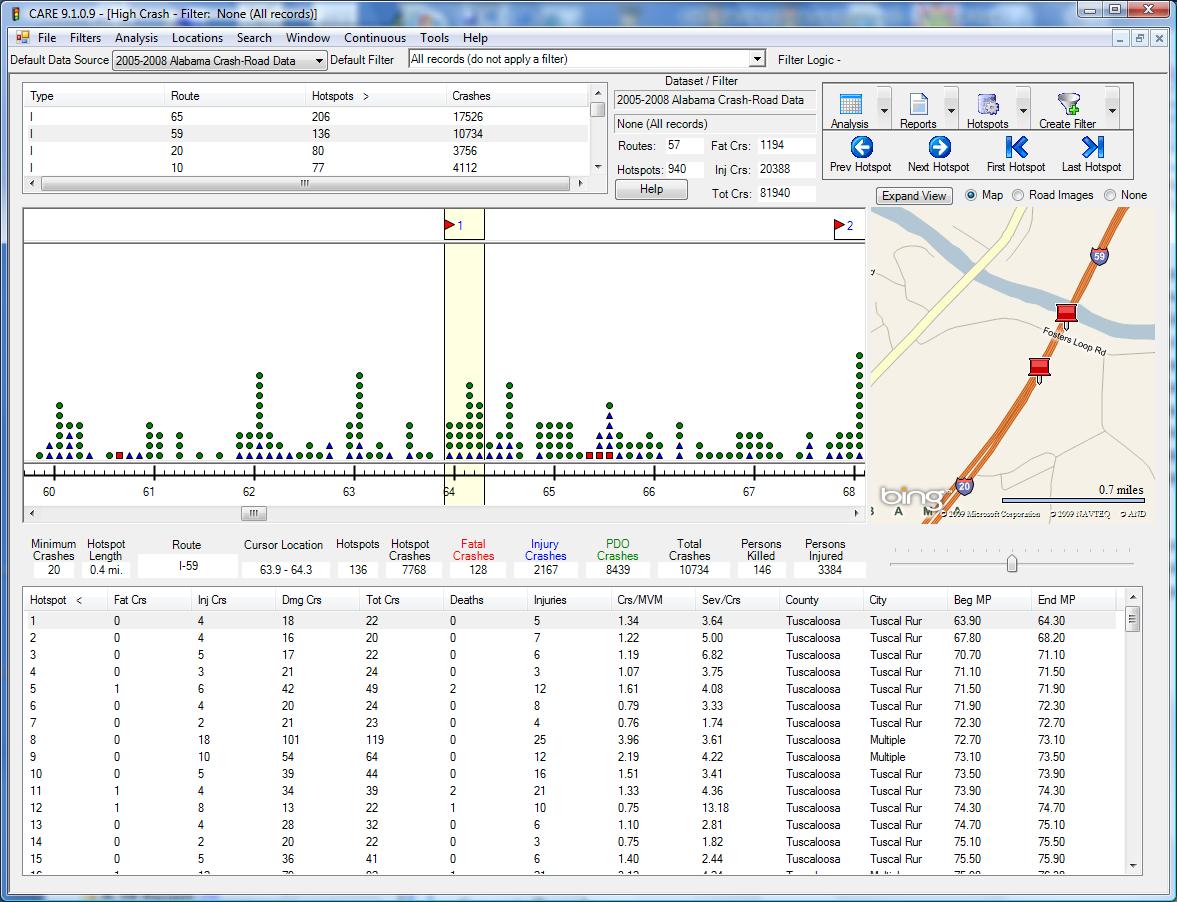
- Hotspot Determination: A hotspot is a location that has a particularly high crash history, sometimes of a particular type of crash (e.g., hotspots for selective enforcement might be defined as those with excessive crashes caused by speed or alcohol). CARE uses a variety of techniques for identifying hotspots. As an example, for mileposted routes, one method is for users to specify a length of the segment and the number of crashes within the segment for it to qualify. For example, in the display given below, the criteria specified was a minimum of 20 crashes in 0.4 miles (note that this is over a four-year period). A map is given along with the strip map to assist engineers in locating the hotspots.
-
- Report Generation: There are many options for producing various helpful reports with just the click of the mouse. Of course, the major reason for identifying hotspots is so that some countermeasure can be applied. Note the “Reports” icon in the upper right corner of the display above. This button leads to a very large number of reports that officers or engineers can take to the location in order to run down just exactly what the problems are. These reports range from overall summaries to detailed information on a per-crash basis. Any of the outputs discussed above can be exported to Microsoft Office products, including Word and Excel, enabling them to be formatted for reports or processed further.
-
- Collision Diagram Generation: Intersection Magic is a powerful collision diagram generator that has been integrated into CARE to automatically draw collision diagrams for any location specified by CARE. This avoids the issues of having to understand all of the database ramifications of collision diagram generation, since once the location is defined within CARE the collision diagram is generated at the click of the mouse. A separate license must be obtained from Pd’ Programming in order to use this feature; Alabama has obtained a statewide license for the use of Intersection Magic.
-
- GIS Integration: Quite analogous to the collision diagram integration, ESRI/ArcGIS has been integrated into CARE enabling analysis results from CARE to be mapped using ArcView with the click of the mouse. In addition, the GIS map can be used to create a filter so that a subset of the mapped crashes can be further analyzed in CARE. For more information on this aspect of CARE’s capabilities, see Crash Mapping Flyer.
-
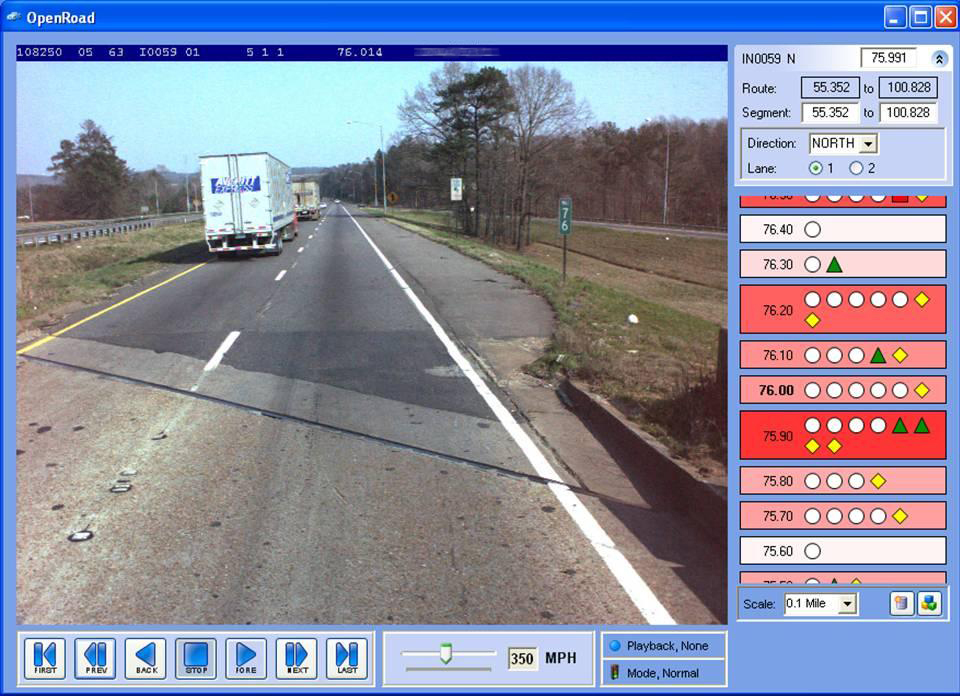
- Open Road: This application links roadway images to route-event data which is generated by the standard CARE software. Users can select a location on a mileposted route and view images along that route just as if they were driving down the road, as shown below.
Along with the roadway images, OpenRoad also displays “events” that occur along the route. An event is defined as any object or occurrence that can be located with a specific route and milepost. Events are represented symbolically by a shape and color. Different types of events can be visually displayed with different symbols. For example, in the example above, fatal crashes are shown as red squares, while serious injury crashes are green triangles, and property damage only crashes are given by circles.
- Open Road: This application links roadway images to route-event data which is generated by the standard CARE software. Users can select a location on a mileposted route and view images along that route just as if they were driving down the road, as shown below.
- Continued Innovations: The Center for Advanced Public Safety (CAPS) constantly strives to improve and enhance the CARE software. Essentially each previous version serves as a prototype for the next version that includes both minor and major improvements, many of which are suggested by CARE’s users. Recent improvements include the following:
- Standard Printing options include: Page Setup, Print, and Print Preview
- Standard Window manipulation capabilities including: Cascade, Tile Horizontally, Tile Vertically, Arrange Icons, and Close All
- User control of the variable ordering, filter grouping and exit setting (all within the Tools menu)
- Dynamic menus: items appear only when available
- Current data set and filter can be changed in most dialogs without changing the default data set and filter or returning to the main screen
- The suppress zero-value frequency checkbox has moved to the results screen allowing quick changes in eliminating non-relevant data
- The variable selection dialogs contain new sorting capabilities
- The tabular and graphical results data may be reordered by any column
- The Over Representation, Max Gain, and Threshold Entries are on the results screen instead of in a pop-up window
Training Documentation
- Safety Portal Instructional Guide
- Safety Portal Training Intro
- CARE Training Documentation for Engineers
Training Videos
Running a Cross-Tabulation
VIDEO COMING SOON
Online Analysis
The Online version of CARE does not contain all the functionality of the desktop version but you can do frequency, crosstab and IMPACT analysis online with public datasets. Click here to do Online Analysis with CARE.


